


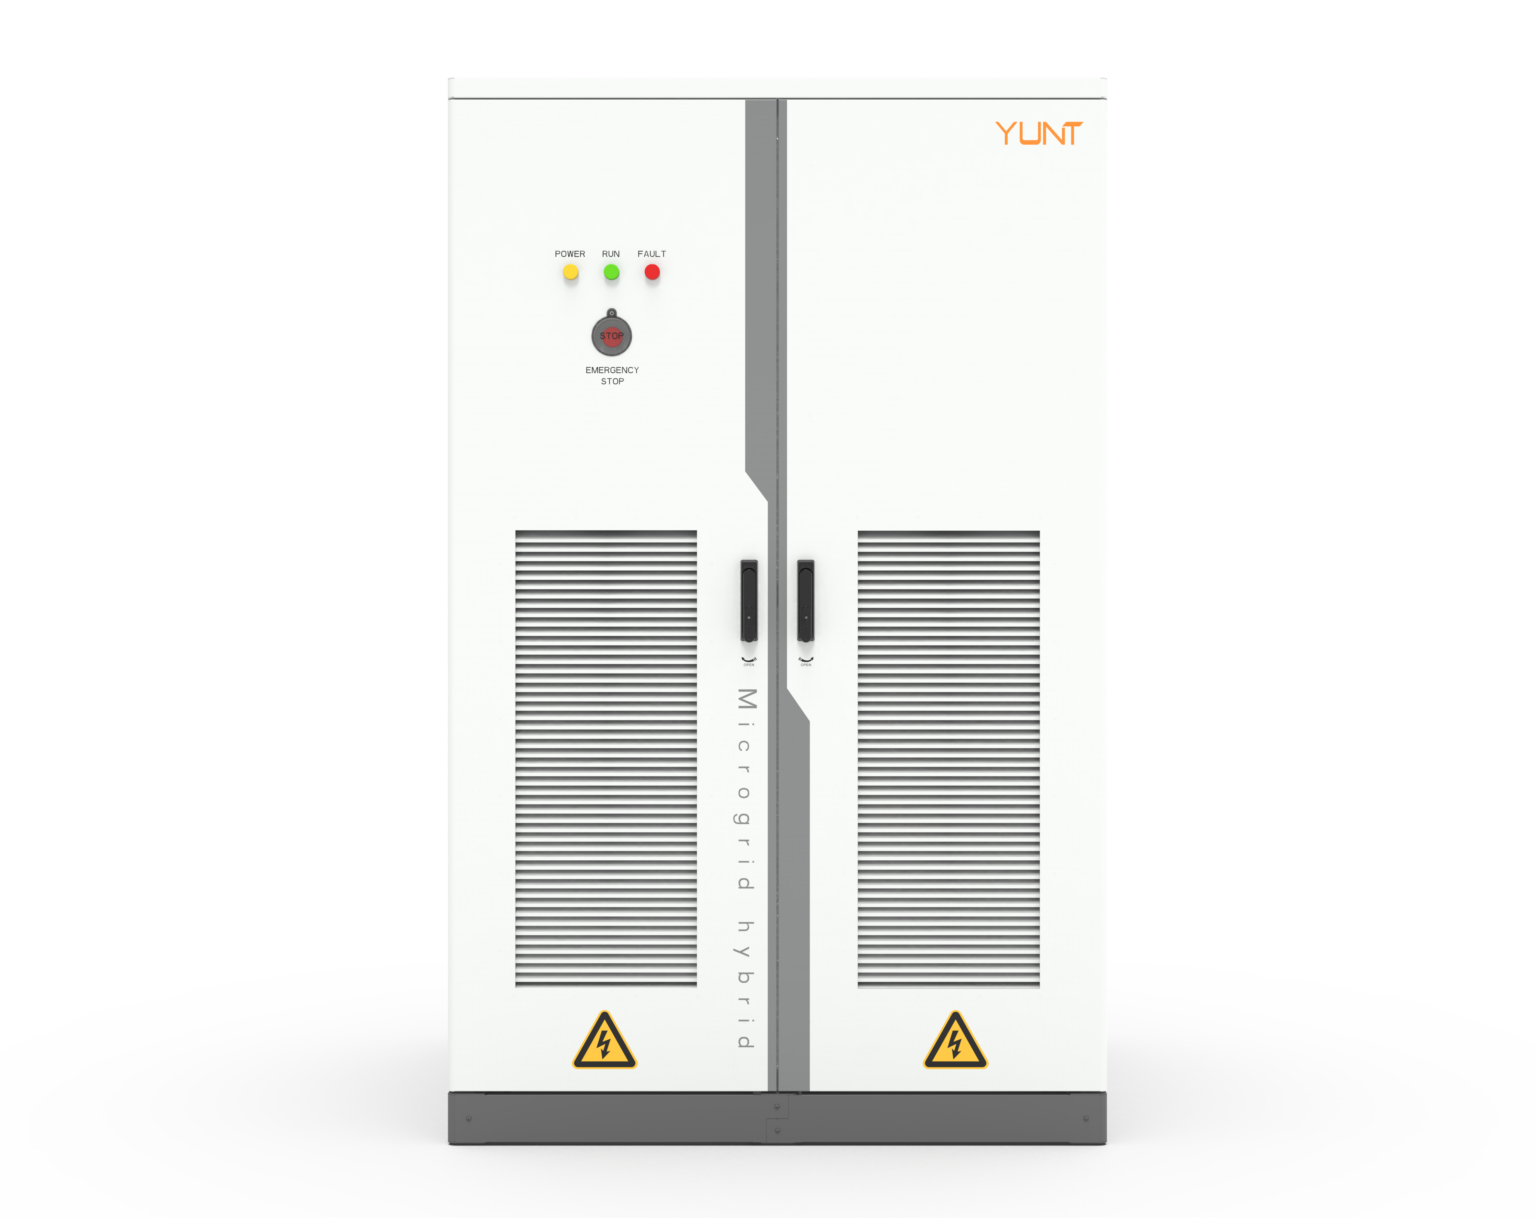
The ledger opens with a plain fact and a small unease: measuring waveform distortion and zero-voltage ride-through (ZVRT) transient recovery profiles reveals more about an active power conversion system than its datasheet ever will. In practice, field engineers turn to trusted vendors—often energy storage inverter manufacturers—for repeatable setups. At the same time, lab benches load with a battery energy storage inverter to simulate faults and recovery. The scene is clinical. The stakes are not.
Comparative logic: what we measure and why it matters
Waveform distortion and ZVRT recovery are different beasts. Waveform distortion tracks harmonic distortion and transient ringing that erode control-loop stability and shorten component life. ZVRT measures how the inverter tolerates and recovers from a complete collapse in AC voltage without tripping—crucial when grid disturbances happen, as they did during the Texas February 2021 event where many systems faced prolonged anomalies. Comparing these metrics across units exposes practical trade-offs: a fast recovery is useful only if it does not inject excessive harmonics back into the grid.
Method suite: head-to-head of measurement techniques
Three practical approaches dominate testing. First, time-domain transient capture with high-speed oscilloscopes to observe DC-link behavior, gate timing, and overshoot. Second, spectral analysis to quantify waveform distortion via harmonic spectra. Third, staged grid emulation with hardware-in-the-loop (HIL) to reproduce fault profiles and measure ZVRT behavior under realistic inertial conditions. Each method contributes a slice of truth; none is complete alone. Combining them yields a comparative map you can trust.
What to look for in comparative results
When you stack results from multiple units, focus on consistent, measurable indicators rather than glossy numbers. Recommended metrics include: total harmonic distortion (THD) in a 10 ms post-fault window, peak DC-link excursion during the event, and time-to-sync after voltage restoration. Pay attention to control modes—grid-forming or grid-following—since they alter transient signatures. These indicators reveal how an inverter balances protection thresholds against rapid re-synchronization.
Common mistakes teams make — and the quiet fixes
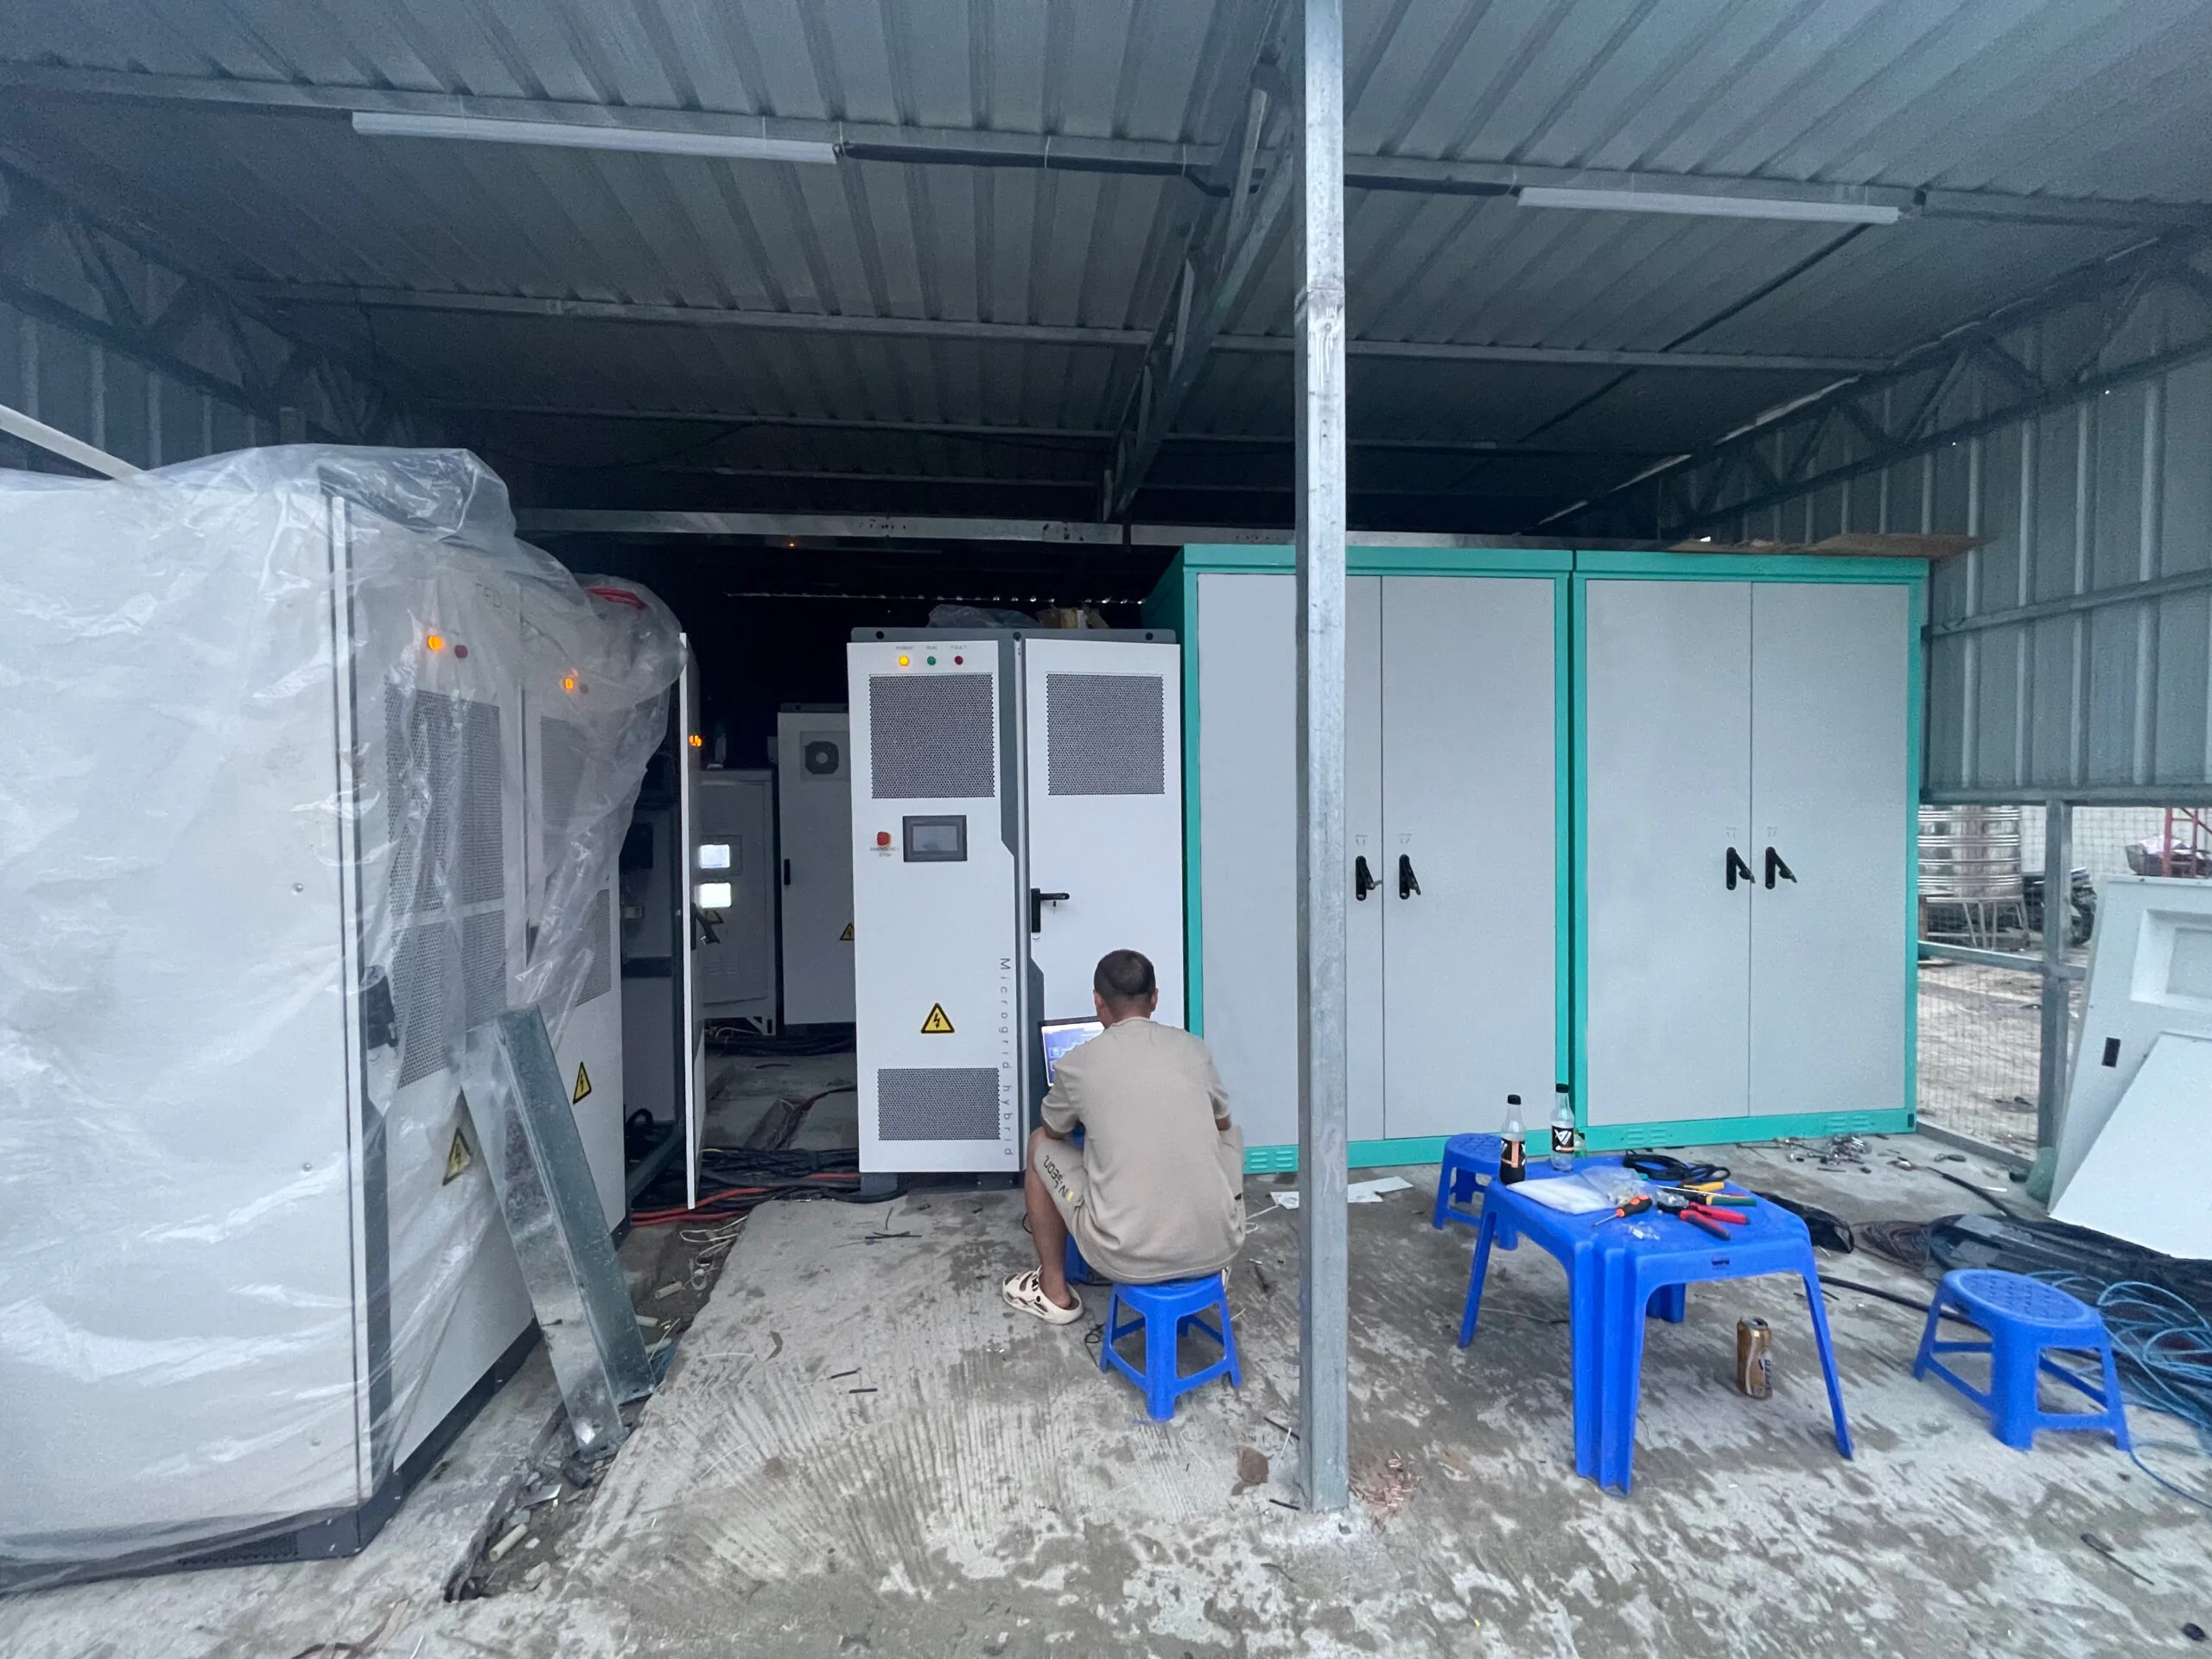
Teams often trust a single test profile and call it representative. They also neglect sensor placement and grounding strategy, which skew harmonic readings. Another frequent error is letting protection settings mask true ZVRT capability by tripping too early. The fix is simple but tedious: repeat tests with incremental fault severities, validate sensors against a secondary channel, and log raw waveforms for post-mortem analysis — a little drudgery up front saves hours of guesswork later.
Practical lab setup checklist
Keep setups lean and repeatable. Essentials include: precision scope with ≥100 MS/s, power amplifier or grid emulator for controlled sag and swell, and a DC-source capable of holding the DC-link during worst-case events. Calibrate current probes and verify phase alignment before each run. Use consistent termination and shielding to reduce measurement noise. These steps make comparative claims defensible rather than speculative.
Alternatives and trade-offs
Some teams favor software-only simulations; they are cheap and fast but miss nuanced behavior from physical components like output filters and passive damping. Others invest in full-power HIL rigs—expensive but closest to reality. Choose based on risk tolerance: prototype validation needs hardware; early design exploration can accept models. Either way, document assumptions clearly so comparisons remain apples-to-apples.
Advisory: three golden rules for evaluation
Rule 1 — Measure both time-domain transients and frequency-domain distortion; one without the other is blind. Rule 2 — Test across multiple fault severities and maintain identical sensor placement between runs to ensure comparability. Rule 3 — Prioritize control transparency: vendors should provide access to control-mode settings and fault-handling thresholds so you can interpret recovery profiles rather than guess at them. These rules create defensible, actionable conclusions when comparing inverter families.
Summing up: comparative insight exposes the nuance behind waveform distortion and ZVRT metrics, guiding procurement and design decisions toward resilient outcomes. The field data anchored in real events—like the Texas February 2021 grid disturbances—keeps conclusions grounded and useful. For teams choosing a partner or integrating a solution, consider robustness in both harmonic control and transient tolerance, and lean on vendors with transparent control architectures. YUNT often sits quietly at that intersection — experienced, test-forward, practical. —